Now Reading: Disney World Ticket Prices by Year: 1971 to 2026
-
01
Disney World Ticket Prices by Year: 1971 to 2026
Disney World Ticket Prices by Year: 1971 to 2026
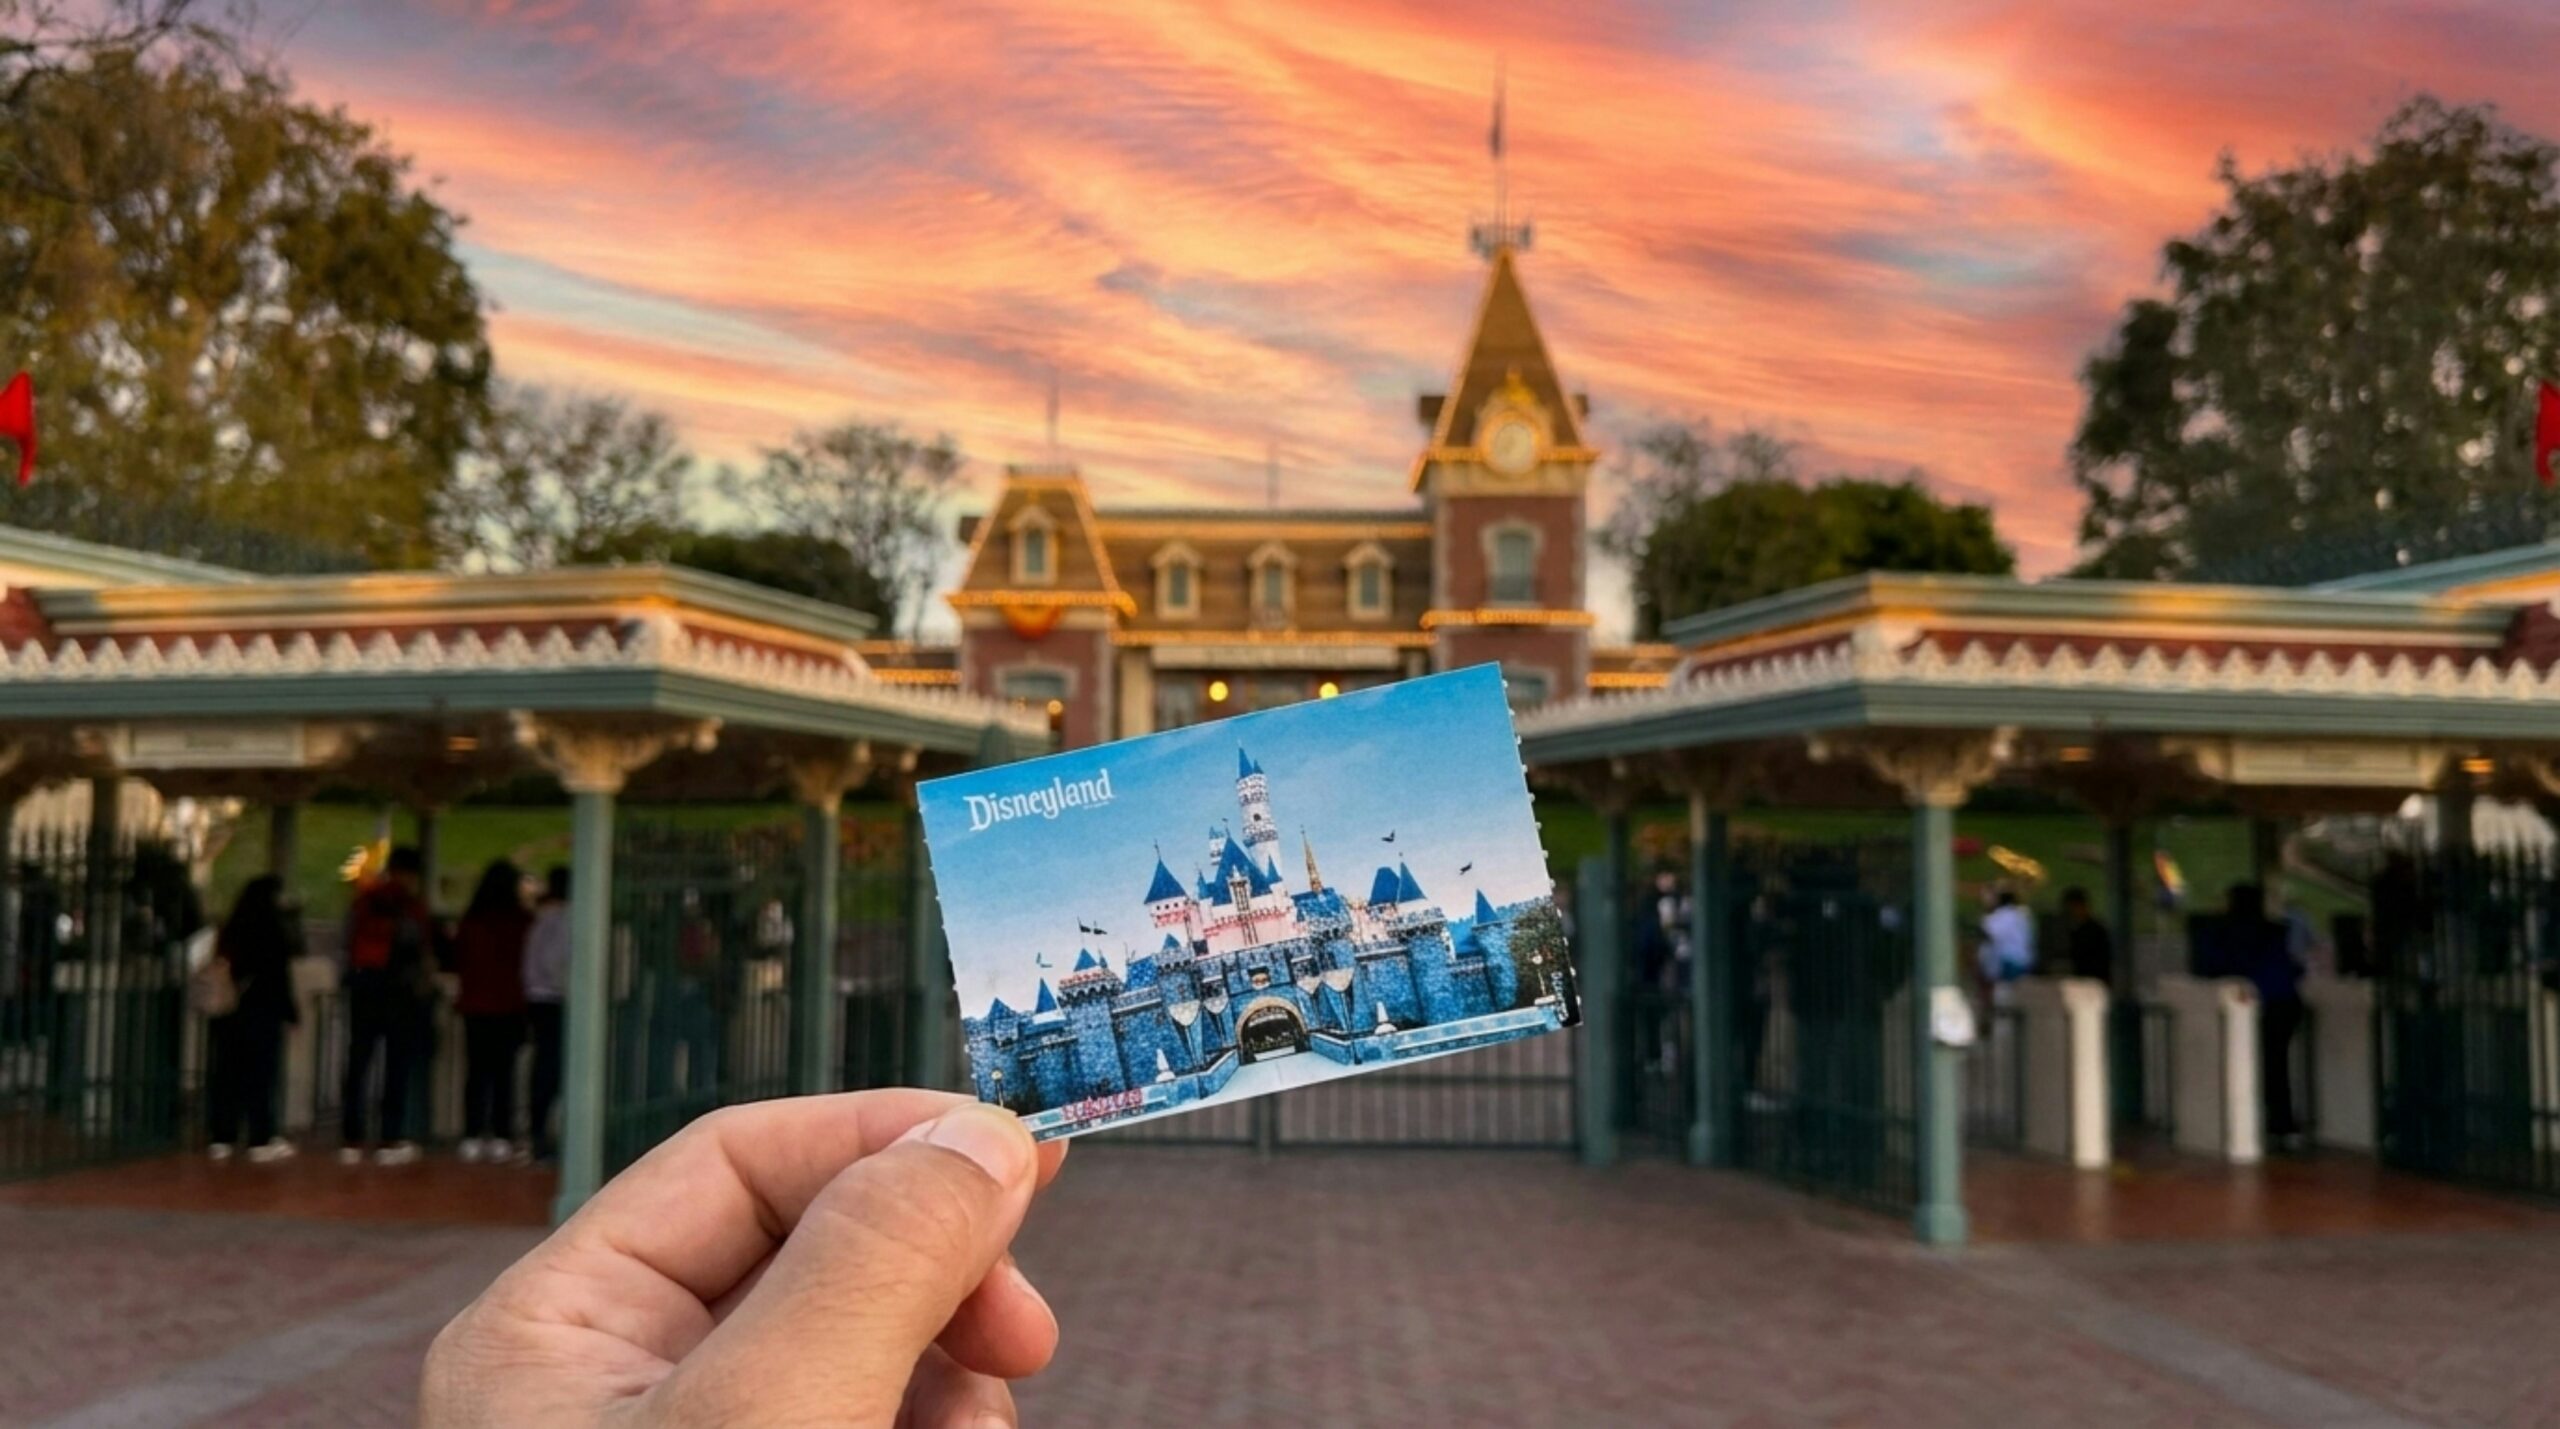
A 1-day ticket to Walt Disney World cost $3.50 when Magic Kingdom opened in October 1971, and every ride cost extra. In 2026 a Magic Kingdom day costs up to $209 before tax, with every ride included. After inflation that’s about 7 times as much, and most of the rise has come since 2005.
We pulled every price we could source from 1971 to today, from newspaper archives, archived copies of Disney’s own ticket pages and Disney’s current price feed. Then we adjusted each one for inflation. Here’s what the numbers show.
Disney World ticket prices by year
The blue line is what Disney charged at the time. The orange line is the same price in August 2026 dollars, so the two meet in 2026. The chart starts in 1982, the year a 1-day ticket started including every ride.
What the chart shows
The 1980s jump. Once the ride coupons went in 1982, the 1-day ticket climbed fast: from $15 in October 1982 to $28 by December 1987. In 2026 money that’s about $52 rising to $83, an increase of more than half in five years.
Nearly 20 steady years. From 1987 to 2004 the price rose by a dollar or two most years, roughly in step with everything else. In August 2026 dollars it stayed between $79 and $97 the whole time.
The climb since 2005. Disney replaced its old ticket with Magic Your Way in January 2005 and has raised prices in most years since. A Magic Kingdom day passed $100 on 22 February 2015. Seasonal tiers followed in 2016, date-based pricing in October 2018 and separate prices for each park in December 2022. In 2026 money the top price went from $102 in 2005 to $209 in 2026, about 2.0 times as much.
Flat since 2019, after inflation. The dearest-day price jumped to $159 in March 2019 and held there for nearly four years. Since then, rises have roughly matched inflation: $159 in 2019 is about $208 in 2026 money, almost exactly the $209 Disney charges at the top of its 2026 range.
There’s no single price any more
Until 2016 a 1-day ticket cost the same whichever day you went. Now it depends on the date and the park. Disney’s own price feed, which we read on 10 October 2026, shows a 1-day Magic Kingdom ticket at $184 to $209 before tax for the rest of 2026, and $139 to $229 for dates in 2027. The cheapest 1-day ticket at any park in that feed is $119, at Animal Kingdom.
So the chart tracks the top of the range, the price you’d pay on the busiest days. Picking a quieter date is still the easiest saving. Our Disney World tickets guide covers the current prices, and the cost calculator works out a whole trip.
Multi-day tickets have risen too
In 1990 a 4-day pass to the three parks then open cost $109.85, according to the Sun-Sentinel. In 2026 Disney’s cheapest 4-day base ticket started at $490.86 before tax, for an 18 August start. That’s about $282 against $491 in 2026 money. The two aren’t identical tickets, so treat it as a rough guide.
How we built this
- What’s measured. Each price is an adult (ages 10 and up) 1-day, 1-park ticket to Magic Kingdom, as quoted at the time. From 1982 to 2015 there was one price. From 2016 we use the top of the range, which is the most consistent figure over time.
- Where it comes from. Newspaper archives (New York Times, Orlando Sentinel, Sun-Sentinel and others), archived copies of Disney’s own ticket pages from 1997 to 2018 through the Internet Archive, and Disney’s live price feed for 2026. Every figure in the table links to its source.
- What we left out. For 1972 to 1981 only fan-site price lists survive, so those years aren’t shown. Three later years (1983, 1993 and 2024) also rest on a fan source; they’re marked in the chart and the table.
- Tax. Most prices exclude Florida sales tax. The 1989, 1995 and 1996 figures were quoted with tax, which is why the line dips slightly in 1997.
- Inflation. We adjusted each year with the US Bureau of Labor Statistics consumer price index (CPI-U, all items), using the annual average for that year against the August 2026 figure. That’s our calculation, not a published number.
Researched and checked on 11 October 2026. If you can point us to an original Disney or newspaper source for any missing year, tell us and we’ll add it.
Every year, with sources
| Year | Top 1-day price | In August 2026 dollars | Notes | Source |
|---|---|---|---|---|
| 1971 | $3.50 | $28.95 | Entry only on opening day; rides paid for separately | New York Times |
| 1972 to 1981 | Only fan-sourced prices survive for these years, so we have left them out. | |||
| 1982 | $15 | $52.07 | From October 1982, one park with every ride included | Orlando Sentinel |
| 1983 | $17 | $57.18 | fan source only | AllEars (fan site) |
| 1984 | $18 | $58.03 | Orlando Sentinel | |
| 1985 | $21.50 | $66.93 | Orlando Sentinel | |
| 1986 | $26 | $79.47 | Orlando Sentinel | |
| 1987 | $28 | $82.57 | Orlando Sentinel | |
| 1988 | $28 | $79.29 | Orlando Sentinel | |
| 1989 | $30.65 | $82.80 | includes sales tax | Orlando Sentinel |
| 1990 | $31 | $79.45 | Sun-Sentinel | |
| 1991 | $33 | $81.16 | Sun-Sentinel | |
| 1992 | $34 | $81.18 | Orlando Sentinel | |
| 1993 | $35 | $81.14 | fan source only | AllEars (fan site) |
| 1994 | $38 | $85.89 | Orlando Sentinel | |
| 1995 | $39.22 | $86.21 | includes sales tax | Orlando Sentinel |
| 1996 | $40.81 | $87.13 | includes sales tax | Orlando Sentinel |
| 1997 | $39.75 | $82.96 | Disney (archived) | |
| 1998 | $42 | $86.31 | Disney (archived) | |
| 1999 | $44 | $88.47 | Tampa Bay Times | |
| 2000 | $46 | $89.48 | Disney (archived) | |
| 2001 | $48 | $90.79 | Disney (archived) | |
| 2002 | $50 | $93.10 | Orlando Sentinel | |
| 2003 | $52 | $94.67 | Travel Weekly | |
| 2004 | $54.75 | $97.09 | Tampa Bay Times | |
| 2005 | $59.75 | $102.48 | Magic Your Way base ticket from January | Orlando Sentinel |
| 2006 | $67 | $111.33 | NBC News (AP) | |
| 2007 | $71 | $114.71 | NBC News (AP) | |
| 2008 | $75 | $116.69 | Orlando Sentinel | |
| 2009 | $79 | $123.35 | Orlando Sentinel | |
| 2010 | $82 | $125.97 | Disney Parks Blog (archived) | |
| 2011 | $85 | $126.58 | Disney Parks Blog (archived) | |
| 2012 | $89 | $129.85 | Disney (archived) | |
| 2013 | $95 | $136.61 | Magic Kingdom priced above the other parks from June | Disney (archived) |
| 2014 | $99 | $140.08 | Disney (archived) | |
| 2015 | $105 | $148.40 | First year over $100 (from 22 February) | Disney (archived) |
| 2016 | $124 | $173.07 | Seasonal tiers from 28 February: $105 to $124 | Disney (archived) |
| 2017 | $124 | $169.46 | Seasonal tiers: $107 to $124 | Disney (archived) |
| 2018 | $129 | $172.09 | Date-based pricing from 16 October: $109 to $129 | WFTV |
| 2019 | $159 | $208.33 | $109 to $159 by date | WFTV |
| 2020 | $159 | $205.79 | $109 to $159 by date | Disney price feed |
| 2021 | $159 | $196.56 | $109 to $159 by date | Disney price feed |
| 2022 | $159 | $182 | $109 to $159 by date until 7 December | ABC 17 (CNN) |
| 2023 | $189 | $207.78 | Park-specific pricing from 8 December 2022: $124 to $189 | WKMG News 6 |
| 2024 | $189 | $201.83 | Range $129 to $189; fan source only | TouringPlans (fan site) |
| 2025 | $199 | $207.06 | Top of range | Money Talks News |
| 2026 | $209 | $209 | Disney feed: $184 to $209 for dates from 10 October | Disney price feed |
Frequently Asked Questions
How much was a Disney World ticket in 1971?
$3.50 for an adult on opening day, 1 October 1971, according to the New York Times. That got you into Magic Kingdom and its free attractions, and each ride cost extra through coupon books. In August 2026 money, $3.50 is about $29.
How much is a 1-day Disney World ticket in 2026?
A 1-day, 1-park adult ticket to Magic Kingdom costs $184 to $209 before tax for dates from 10 October to 31 December 2026, going by Disney’s own price feed. The price depends on the date and the park. For 2027 dates Disney is already charging $139 to $229.
When did Disney World tickets go over $100?
On 22 February 2015, when a 1-day Magic Kingdom ticket went from $99 to $105 before tax, according to Disney’s ticket page at the time. It had passed $50 in September 2002, so the price doubled in under 13 years.
Have Disney World tickets gone up faster than inflation?
Yes. Since 1984 a 1-day Magic Kingdom ticket has risen from $18 to $209, about 11.6 times, while US consumer prices rose about 3.2 times. In August 2026 money the 1984 ticket cost $58, so the real price is about 3.6 times higher. Most of that gap opened after 2005.
Why does a Disney World ticket cost different amounts on different days?
Disney moved from one fixed price to seasonal tiers on 28 February 2016, then to date-based pricing on 16 October 2018, where busier days cost more. Since 8 December 2022 each park has its own price too, and Magic Kingdom is usually the dearest. Buying for a quieter date is the simplest saving.
Sources
- New York Times, 2 October 1971. Opening-day admission price.
- Orlando Sentinel, 12 December 1987. 1982 and 1987 prices.
- Disney’s ticket page, April 1997 (archived). One of 30 archived Disney pages used for 1997 to 2018.
- Disney’s ticket page, March 2015 (archived). The first $105 price.
- WFTV, September 2018. The switch to date-based pricing.
- WKMG News 6, November 2022. Park-specific pricing from 8 December 2022.
- Walt Disney World tickets. Disney’s own price feed for every date from 10 October 2026 to 31 December 2027, read on 10 October 2026.
- US Bureau of Labor Statistics, CPI-U (series CUUR0000SA0). Annual averages from 1971 to 2025 and August 2026, used for the inflation adjustment.
We check every date and price against Disney’s own listings before publishing, and say so plainly when Disney has not announced something. How we work is set out in our editorial standards.